Getting Started with Strym
[1]:
import strym
from strym import strymread
import matplotlib.pyplot as plt
import pandas as pd
import numpy as np
import urllib.request
/home/ivory/anaconda3/envs/dbn/lib/python3.7/site-packages/statsmodels/tools/_testing.py:19: FutureWarning: pandas.util.testing is deprecated. Use the functions in the public API at pandas.testing instead.
  import pandas.util.testing as tm
[2]:
dbcfile = '/home/ivory/VersionControl/Jmscslgroup/strym/examples/newToyotacode.dbc'
[3]:
%%time
folder = "/home/ivory/CyverseData/JmscslgroupData/PandaData/2020_08_13/"
file= "2020-08-13-13-26-45_2T3Y1RFV8KC014025_CAN_Messages.csv"
r =strymread(csvfile=folder + file, dbcfile = dbcfile, createdb = True, verbose=False)
UNIQUE constraint failed: RAW_CAN.Clock, RAW_CAN.Bus, RAW_CAN.MessageID
CPU times: user 21.6 s, sys: 1.02 s, total: 22.6 s
Wall time: 16.7 s
[4]:
r.dataframe
[4]:
| Time | Bus | MessageID | Message | MessageLength | |
|---|---|---|---|---|---|
| Clock | |||||
| 2020-08-13 20:26:46.108451843 | 1.597350e+09 | 2 | 835 | 0000430000000091 | 8.0 |
| 2020-08-13 20:26:46.108451843 | 1.597350e+09 | 0 | 835 | 0000430000000091 | 8.0 |
| 2020-08-13 20:26:46.108451843 | 1.597350e+09 | 2 | 705 | 08ff86ff8cbc009f | 8.0 |
| 2020-08-13 20:26:46.108451843 | 1.597350e+09 | 0 | 705 | 08ff86ff8cbc009f | 8.0 |
| 2020-08-13 20:26:46.108793974 | 1.597350e+09 | 2 | 452 | 0383260838007f38 | 8.0 |
| ... | ... | ... | ... | ... | ... |
| 2020-08-13 20:37:17.848950863 | 1.597351e+09 | 1 | 441 | de7ffc00000ffc26 | 8.0 |
| 2020-08-13 20:37:17.849765062 | 1.597351e+09 | 1 | 442 | de7ffc00000ffc27 | 8.0 |
| 2020-08-13 20:37:17.849765062 | 1.597351e+09 | 2 | 401 | e2ff8830646400fb | 8.0 |
| 2020-08-13 20:37:17.849765062 | 1.597351e+09 | 0 | 401 | e2ff8830646400fb | 8.0 |
| 2020-08-13 20:37:17.850608110 | 1.597351e+09 | 1 | 443 | de7ffc00000ffc28 | 8.0 |
2509598 rows × 5 columns
[5]:
r.dataframe.head()
[5]:
| Time | Bus | MessageID | Message | MessageLength | |
|---|---|---|---|---|---|
| Clock | |||||
| 2020-08-13 20:26:46.108451843 | 1.597350e+09 | 2 | 835 | 0000430000000091 | 8.0 |
| 2020-08-13 20:26:46.108451843 | 1.597350e+09 | 0 | 835 | 0000430000000091 | 8.0 |
| 2020-08-13 20:26:46.108451843 | 1.597350e+09 | 2 | 705 | 08ff86ff8cbc009f | 8.0 |
| 2020-08-13 20:26:46.108451843 | 1.597350e+09 | 0 | 705 | 08ff86ff8cbc009f | 8.0 |
| 2020-08-13 20:26:46.108793974 | 1.597350e+09 | 2 | 452 | 0383260838007f38 | 8.0 |
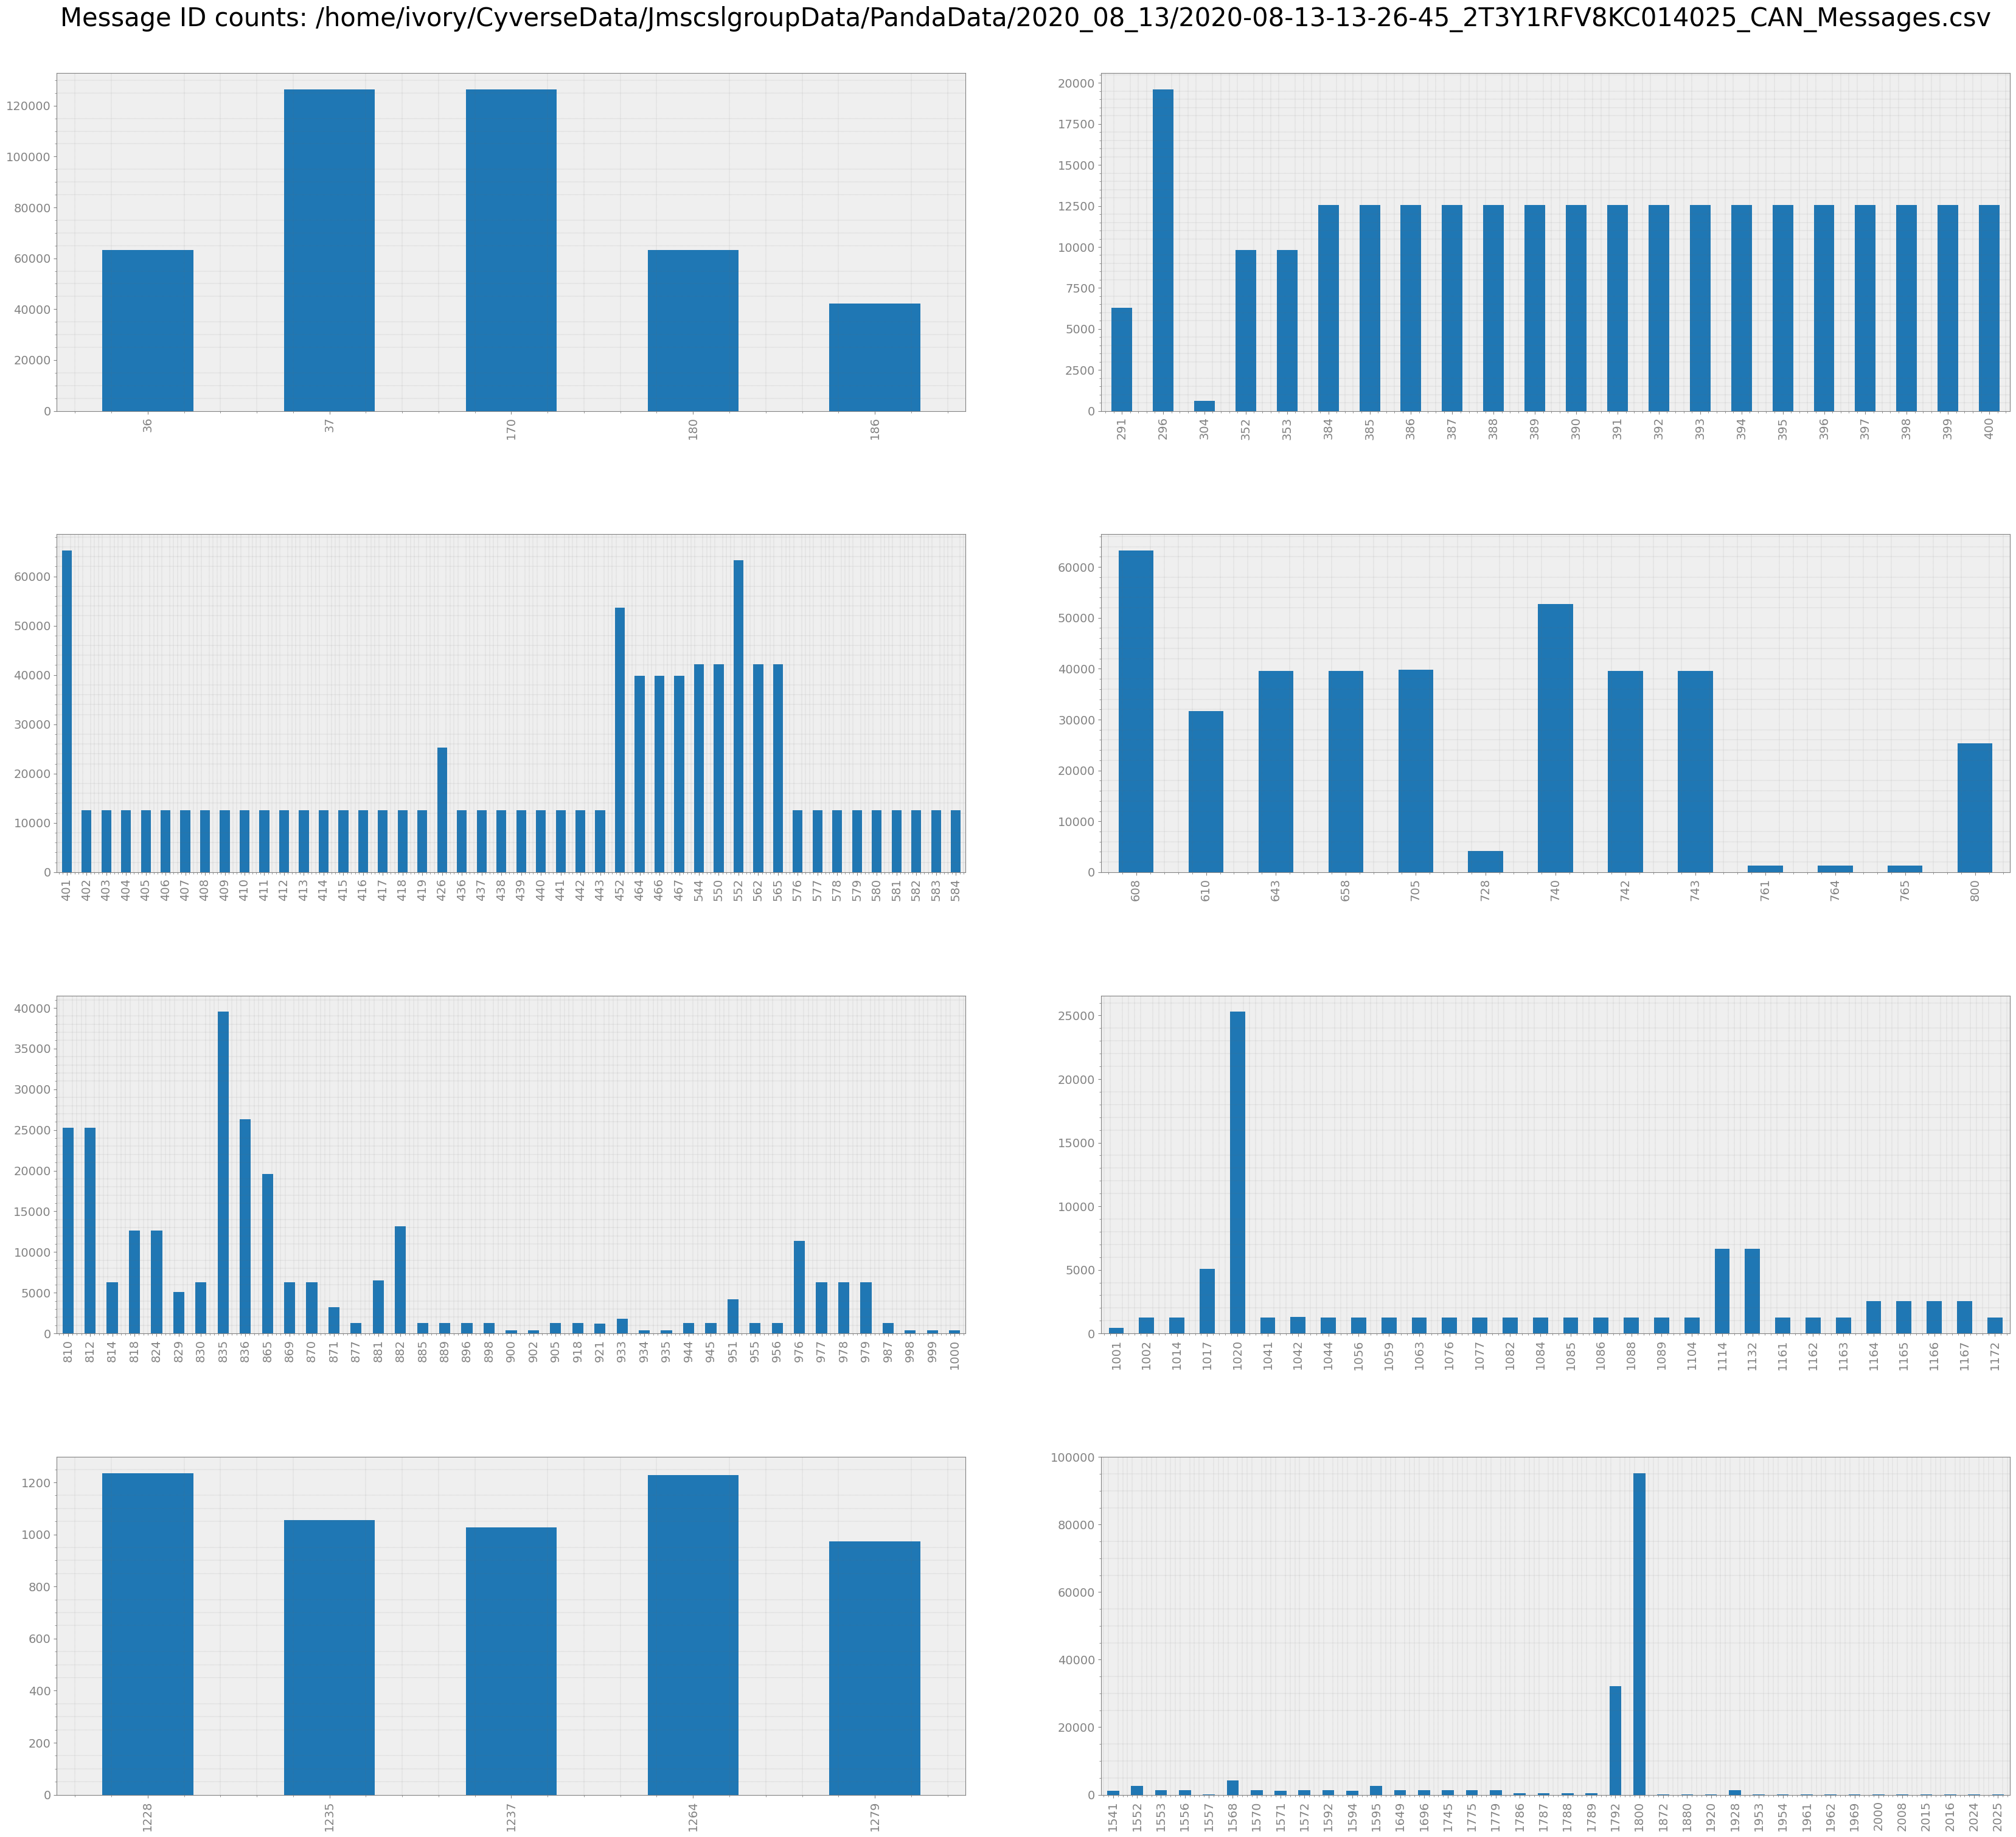
Get the count of all messages
[6]:
count = r.count(plot = True)
count
[6]:
| MessageID | Counts_Bus_0 | Counts_Bus_1 | Counts_Bus_2 | TotalCount | |
|---|---|---|---|---|---|
| 36 | 36 | 31626 | 0 | 31626 | 63252 |
| 37 | 37 | 63252 | 0 | 63252 | 126504 |
| 170 | 170 | 63252 | 0 | 63252 | 126504 |
| 180 | 180 | 31626 | 0 | 31626 | 63252 |
| 186 | 186 | 21084 | 0 | 21084 | 42168 |
| ... | ... | ... | ... | ... | ... |
| 2008 | 2008 | 48 | 0 | 48 | 96 |
| 2015 | 2015 | 24 | 0 | 24 | 48 |
| 2016 | 2016 | 3 | 0 | 3 | 6 |
| 2024 | 2024 | 26 | 0 | 26 | 52 |
| 2025 | 2025 | 17 | 0 | 17 | 34 |
200 rows × 5 columns
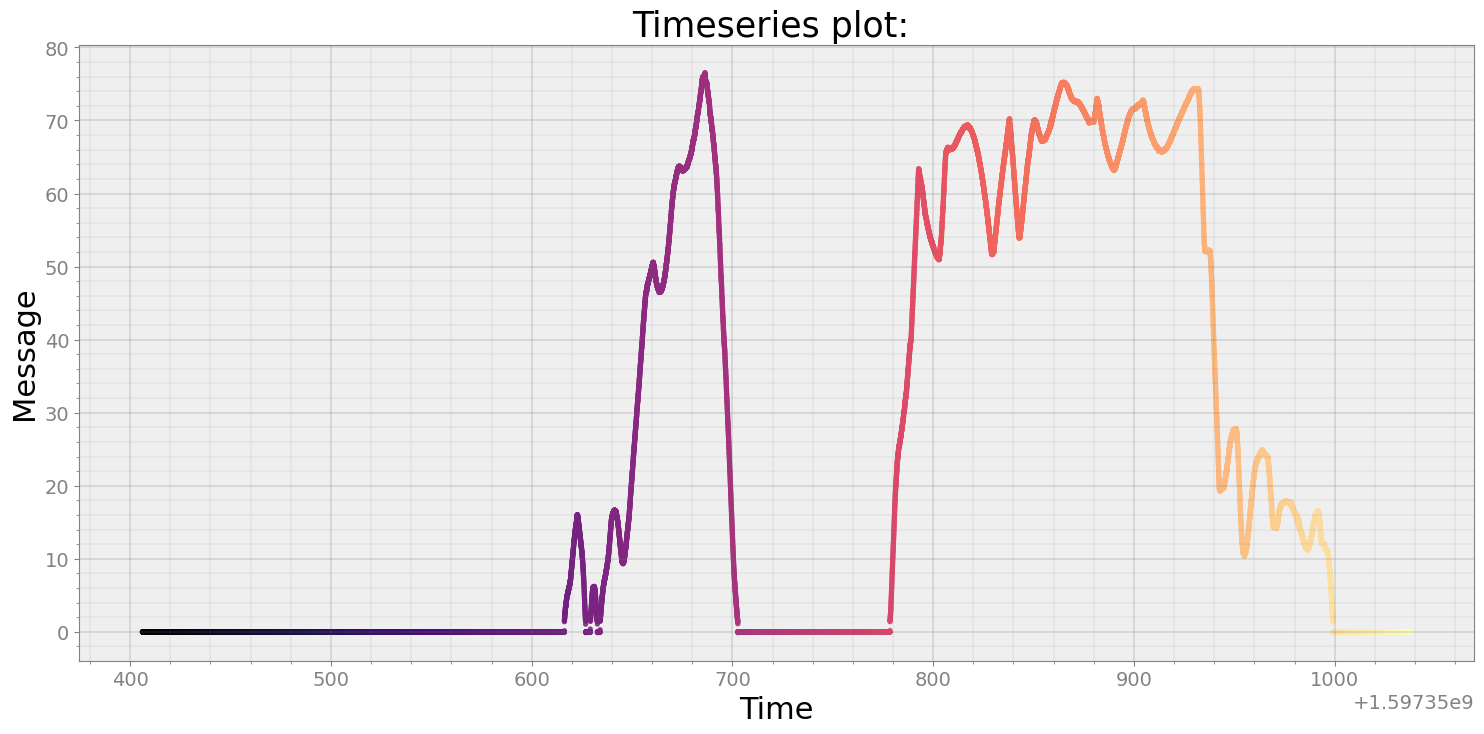
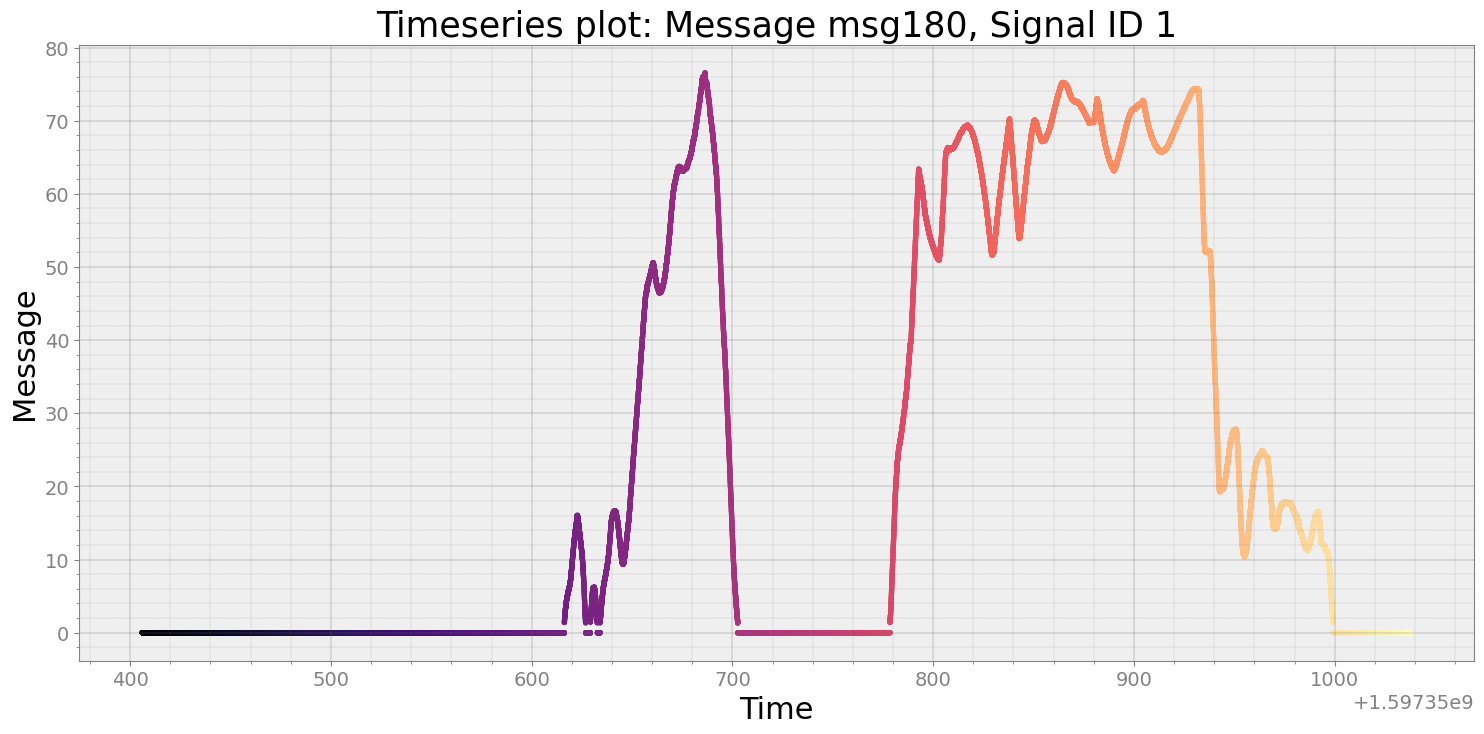
Reading a signal from a particular message ID
[7]:
msg180 = r.get_ts(msg=180, signal=1)
[8]:
msg180
[8]:
| Time | Message | Bus | |
|---|---|---|---|
| Clock | |||
| 2020-08-13 20:26:46.109022141 | 1.597350e+09 | 0.0 | 2 |
| 2020-08-13 20:26:46.109022141 | 1.597350e+09 | 0.0 | 0 |
| 2020-08-13 20:26:46.111299038 | 1.597350e+09 | 0.0 | 2 |
| 2020-08-13 20:26:46.111299038 | 1.597350e+09 | 0.0 | 0 |
| 2020-08-13 20:26:46.113986015 | 1.597350e+09 | 0.0 | 2 |
| ... | ... | ... | ... |
| 2020-08-13 20:37:17.794481993 | 1.597351e+09 | 0.0 | 0 |
| 2020-08-13 20:37:17.814836025 | 1.597351e+09 | 0.0 | 2 |
| 2020-08-13 20:37:17.815034866 | 1.597351e+09 | 0.0 | 0 |
| 2020-08-13 20:37:17.834714174 | 1.597351e+09 | 0.0 | 2 |
| 2020-08-13 20:37:17.834714174 | 1.597351e+09 | 0.0 | 0 |
63252 rows × 3 columns
Quality Check of Data Rate of Particular Message
[15]:
ts_speed = r.speed()
strymread.ranalyze(msg180)
Analyzing Timestamp and Data Rate of Timeseries
Interquartile Range of Rate for Timeseries is 1.3397845087453533
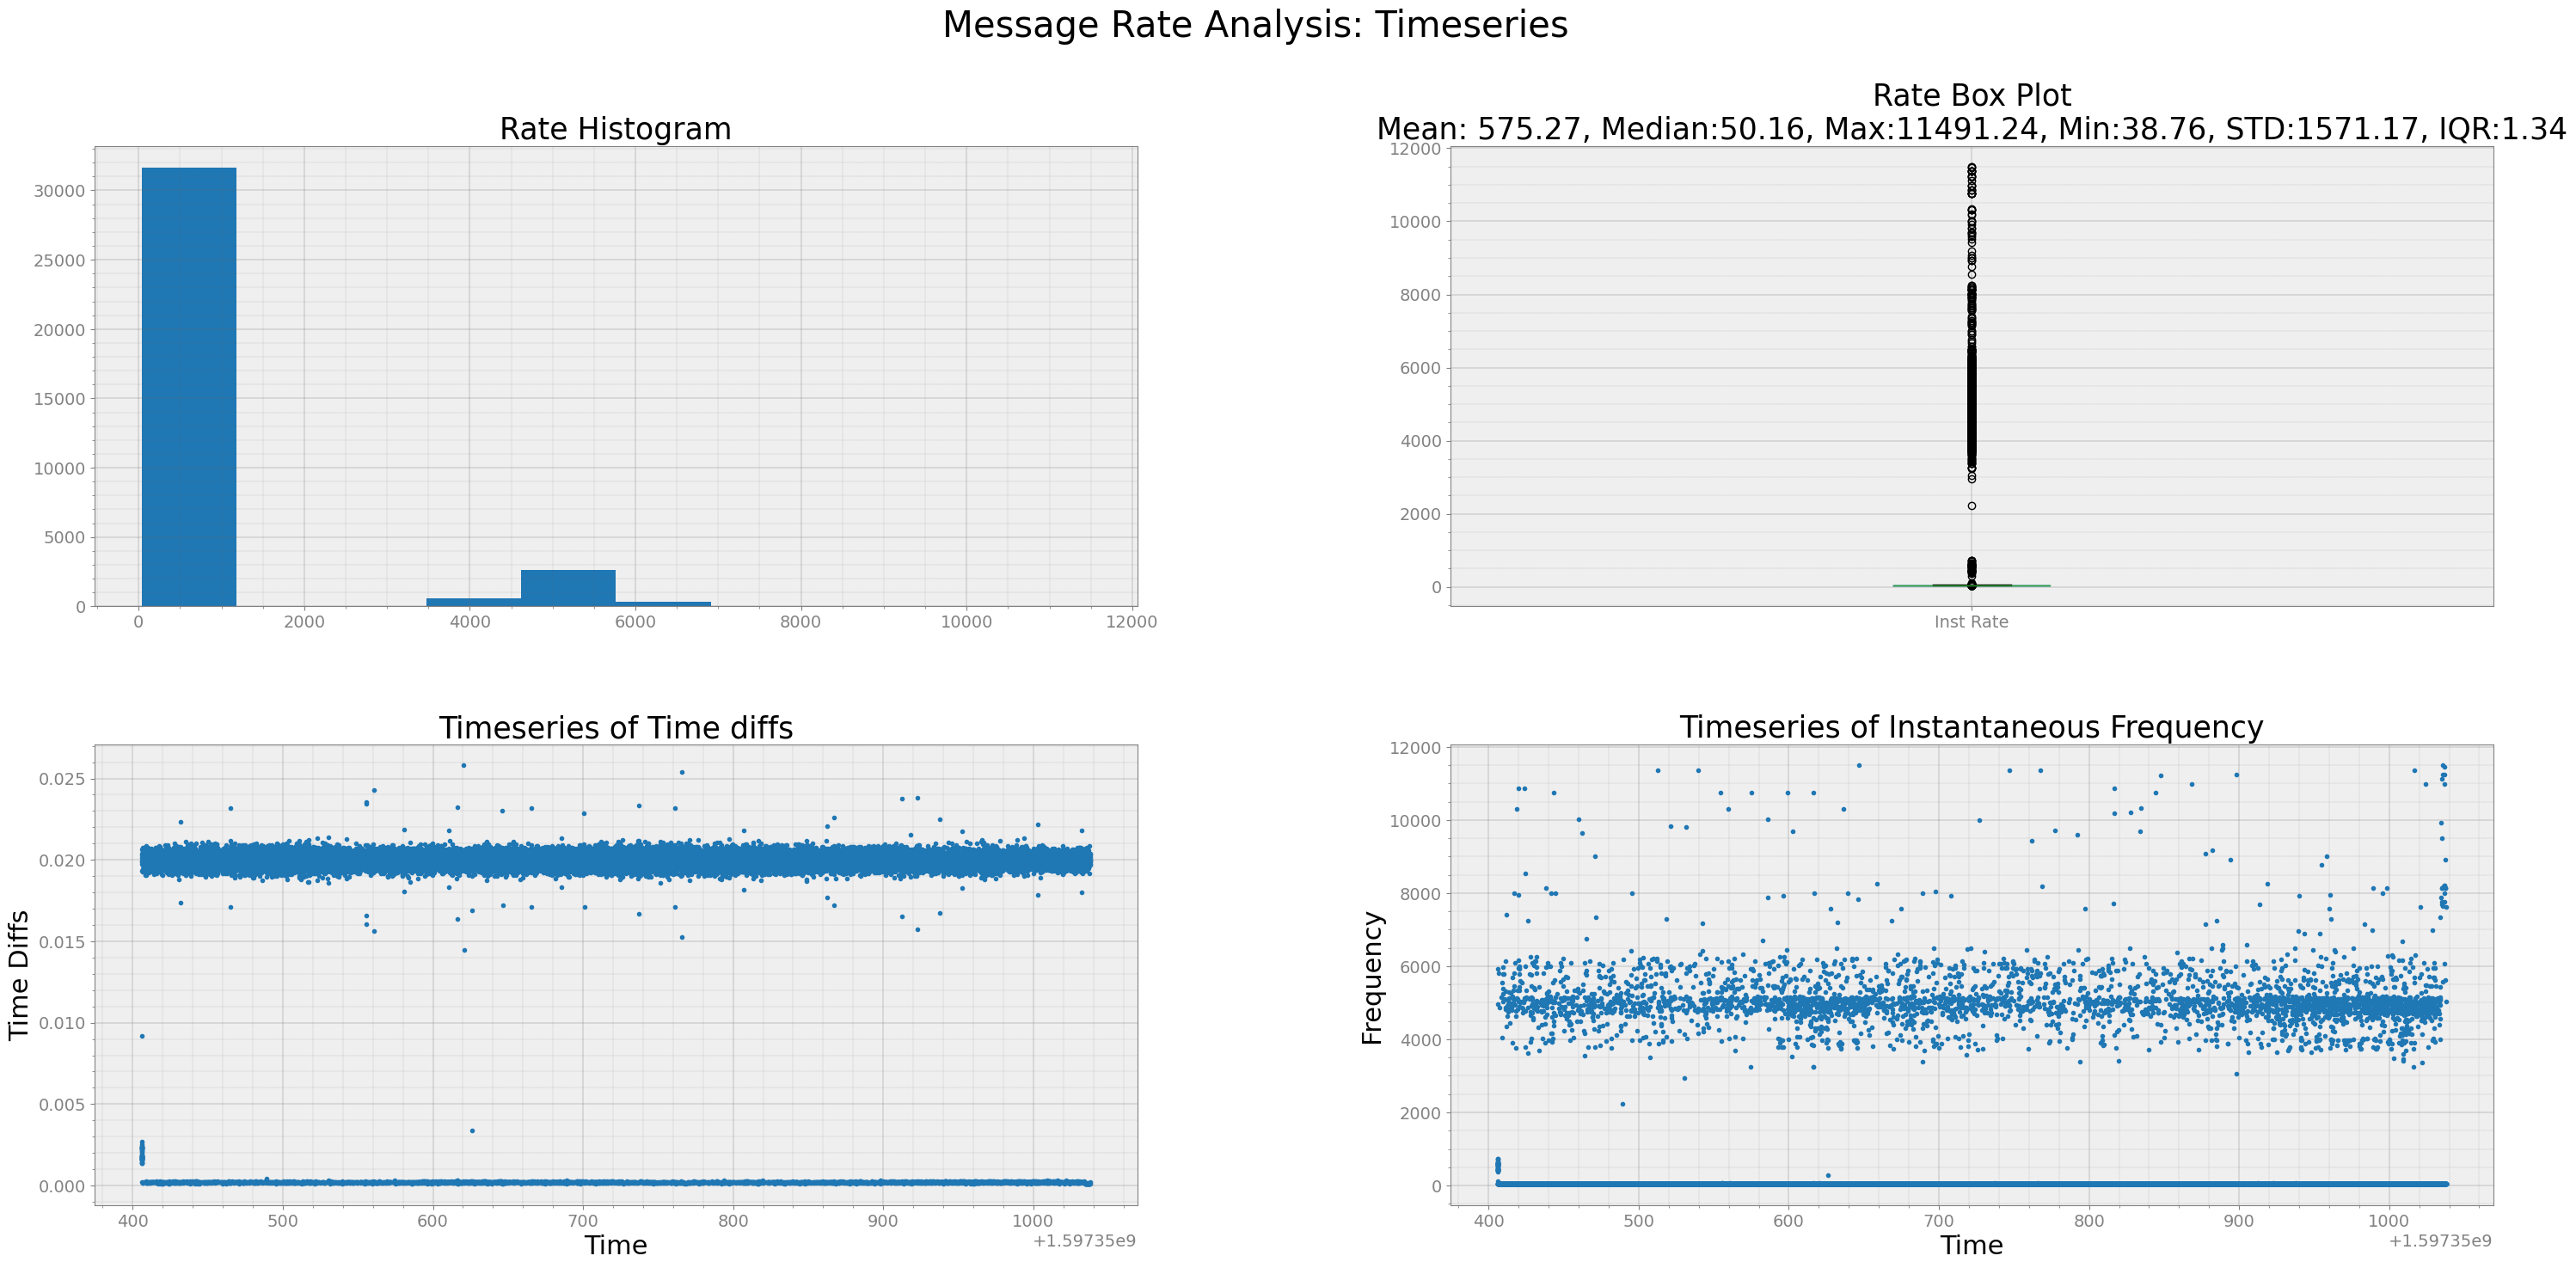
From above plots, we can see that most message were received within sampling time of 0.02s or 50 Hz.
[12]:
resampled180 = strymread.resample(msg180, rate = 50)
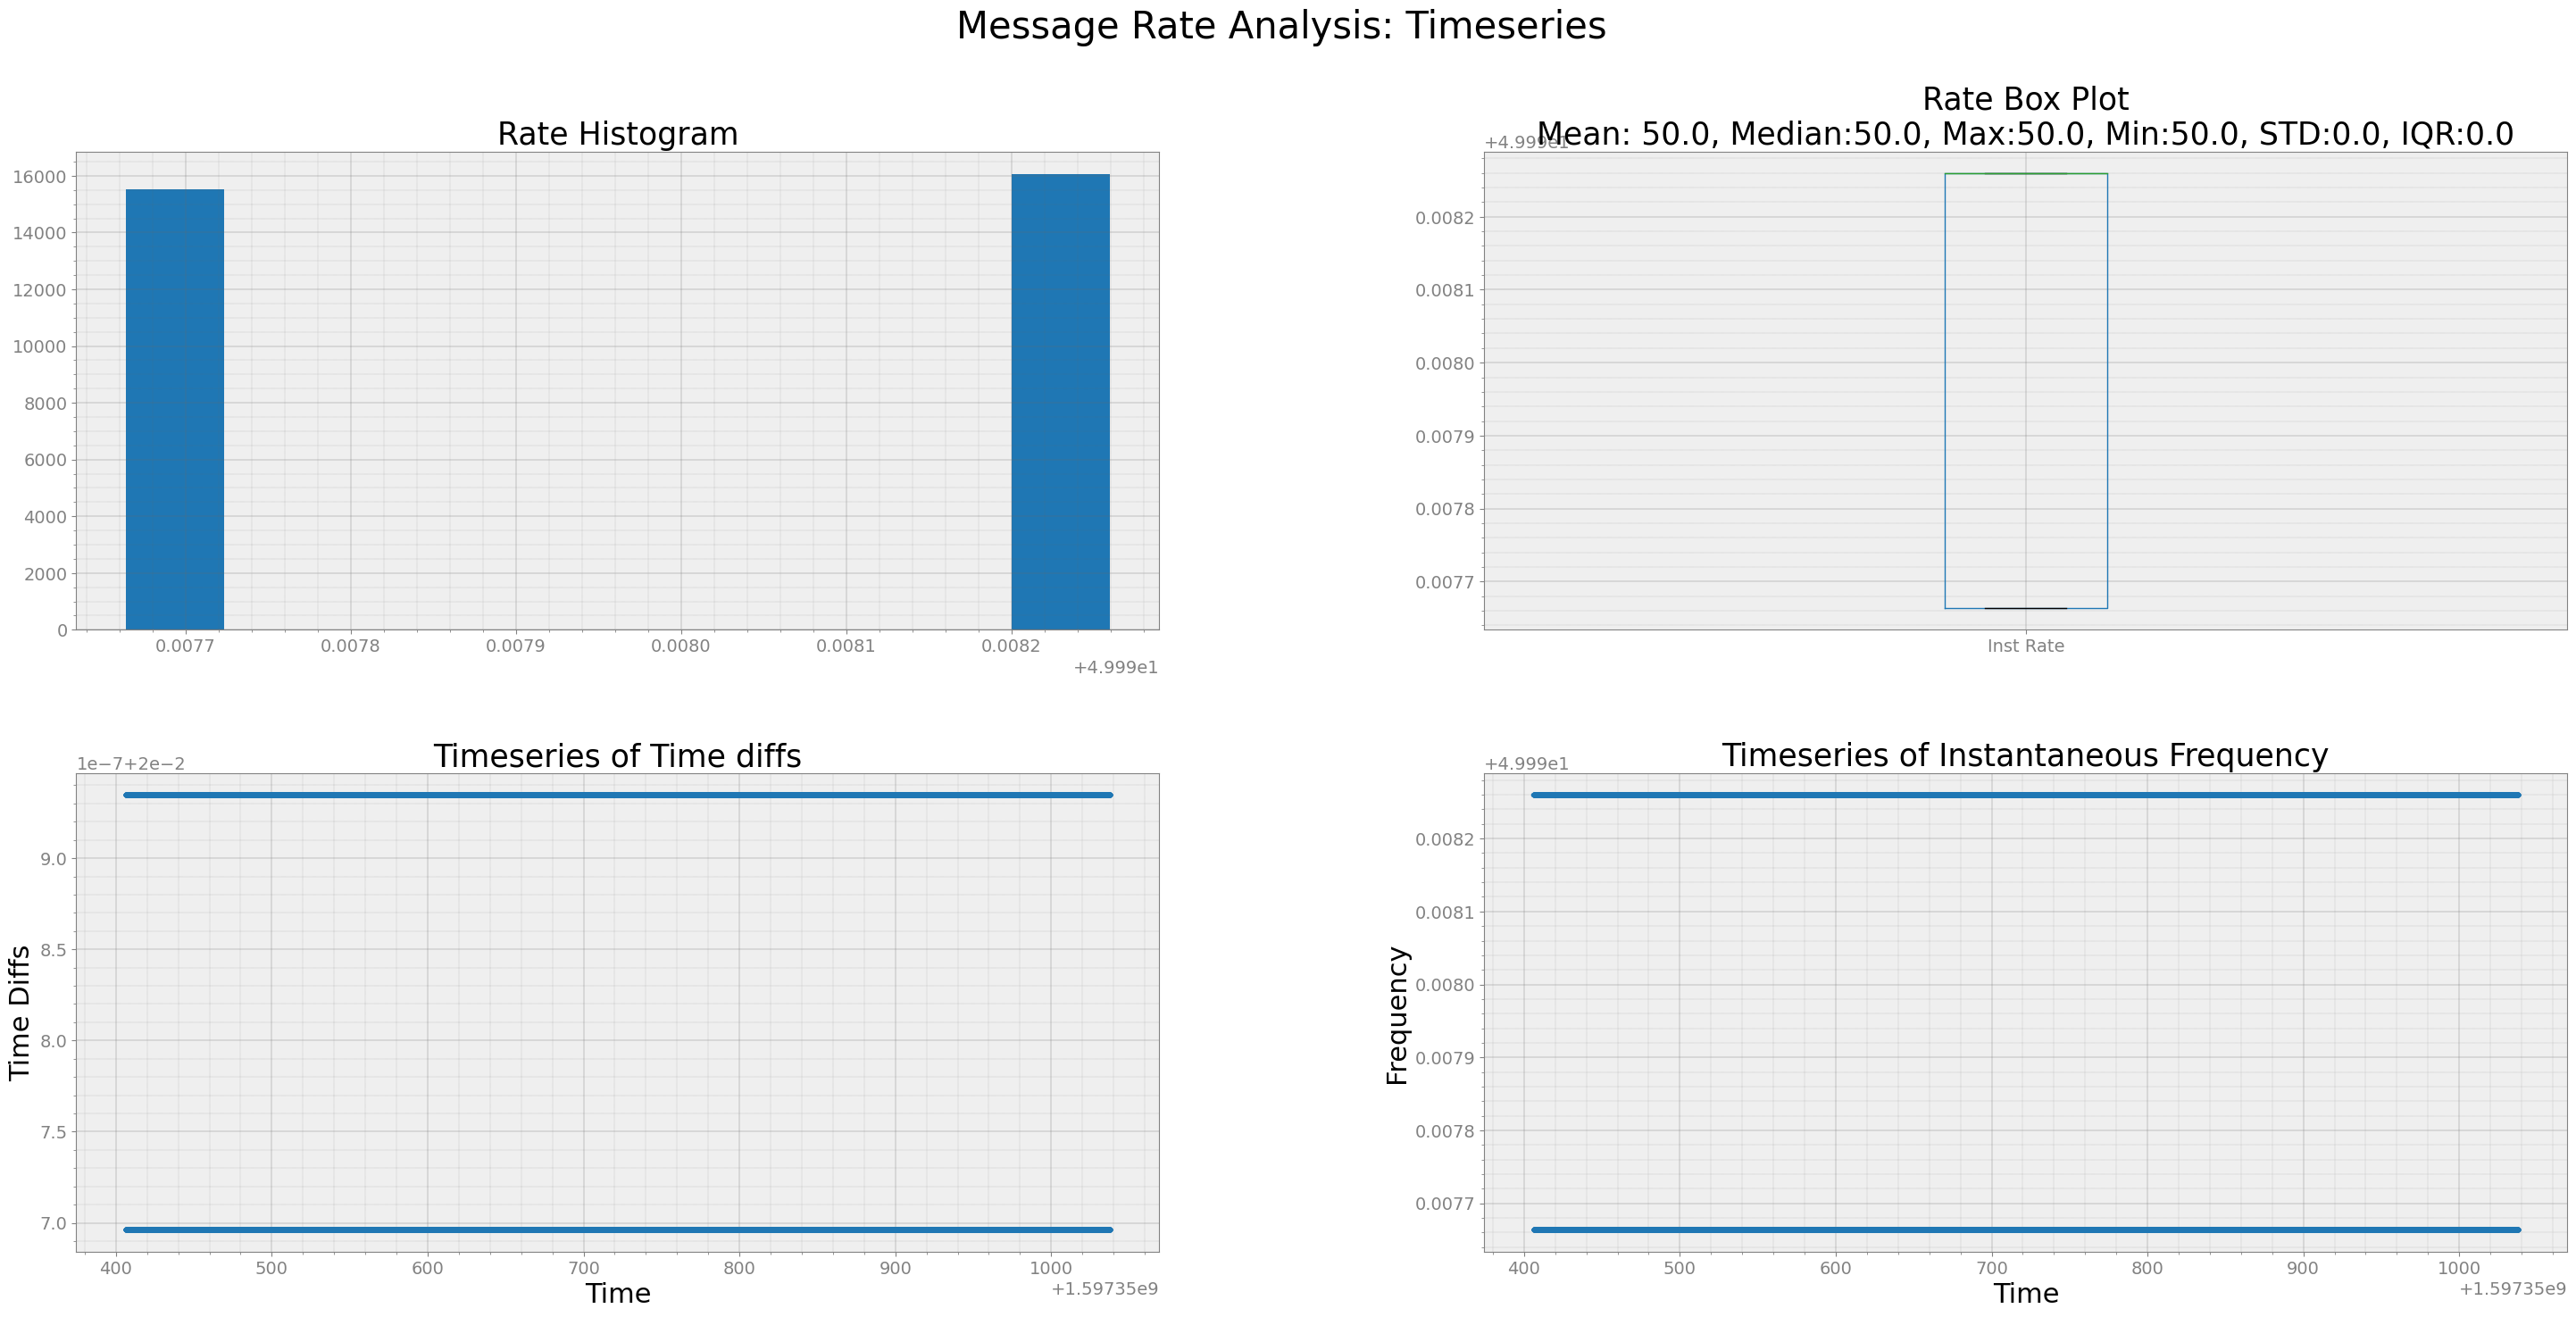
strymread.ranalyze(resampled180)
Analyzing Timestamp and Data Rate of Timeseries
Interquartile Range of Rate for Timeseries is 0.0005959978496221652
[13]:
strymread.plt_ts(resampled180)